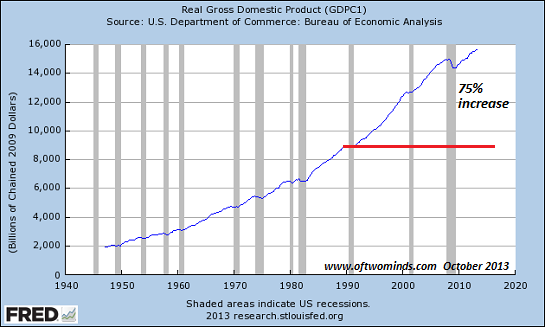
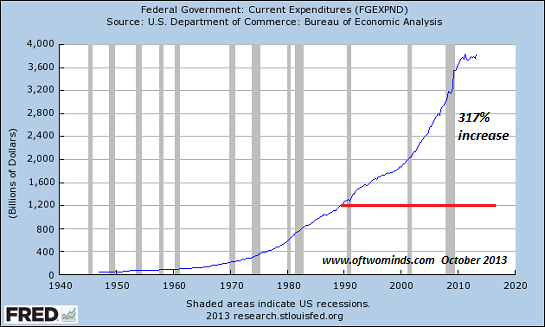
With the Social Security ratio of workers to dependent going from 16:1 in 1950 to close to 2:1 today, there is a tidal wave approaching. The government shutdown and debt limit ceiling debacle did not play out well. And the next battle is just a couple of months away. The real story that the politicians need to explain is how a 75% increase in GDP can support a 300% increase in spending.
I guess Obama was right, he is out to radically transform the country.
Click the link below for the rest of the charts.
http://www.oftwominds.com/blogoct13/peak-entitlements10-13.html


No comments:
Post a Comment
You are not entitled to your opinion. You are entitled to your informed opinion. No one is entitled to be ignorant.
Harlan Ellison